
preview
- create proportional web graphics to represent quality graphics quickly and consistently, especially when an image or a format-size is likely to be re-used.
- use a scale of proportion that complements the particular design scenario.
- use metric units to keep calculations in terms of whole numbers and decimal fractions.
- configure your computer and software to show scales in terms of metric units.
introduction
one of the most convenient ways to create web graphics that are proportional to a particular design format is to use a convenient scale of proportion. on a web page this often involves scaling a measure of length to a common measure of screen resolution. some web authoring applications provide methods to automatically re-size a proportional web graphic. oftentimes however, designers create a web graphic with a specific graphic or image editing application, and then save a compressed version to a particular scale of proportion for the web. this article describes methods that can be used to readily determine dimensions for a designated scale of proportion.
determining the unit of measure
a common measure of screen resolution is a pixel (picture element), and the size of a pixel on a device depends on the display resolution. thus a graphic of size 300 by 300 pixels will occupy a display area that can vary depending on the display resolution. examples of appliances with different display resolution include a desktop computer, a smart phone, or a projection display.
the choice of a metric unit of length like the millimeter (mm) can simplify calculations involved in scaling the area of a graphic to a particular size. With a metric unit all calculations can be made in terms of whole number or decimal fraction numbers. expressing sizes by the millimeter eliminates the need to have to re-express fractions (such as 1/2, 1/4, 1/8, 1/16, and so forth) in terms of another denominator when calculating a scale factor.
the particular unit of length used will mainly depend on the subject of the graphic. generally it is useful to choose a unit that is convenient for the scale of the subject. a microscopic subject such as an area of a microchip might be usefully expressed by the nanometer. whereas a macroscopic subject such as a planet might be usefully expressed by the kilometer. for many subjects in the frame of our everyday world the units of meter or millimeter are practicable. (sometimes however it is useful to use a 'unit of comparison', such as an astronomical unit [AU] defined as the average distance from the Sun to the Earth.)
determining the scale of proportion
the scale of proportion depends largely on the particular design scenario. the design scenario often refers to the particular medium to be used, such as a web page, mobile web page, and so forth. if the format-size of a graphic, and a scale of proportion, are known, then you are ready to determine the size of a graphic for a particular medium. for example, the graphic for a CD cover is typically in the proportion of a square, and printed to a size of 120 by 120 mm. web retailers also use designated sizes of web graphics for music in the same proportion of a CD cover. these sizes can include a larger page-sized graphic, in addition to smaller thumbnail-sized graphics.
for the example of an astronomical unit [AU] of the average distance from the Sun to the Earth, a chart of average solar distances can be represented on a web page. if a scale of proportion of 10 pixels for 1 astronomical unit (1 AU : 10 px) is applied, then 10 pixels represents the average solar distance from the Sun to the Earth. in this scale of proportion the average distance from the Sun to Pluto could be represented by a span of 395 pixels.
similarly to illustrate a comparison of the equatorial diameter of the Earth with the measures for other objects in the solar system, the equatorial diameter of Earth can be scaled to 10 pixels ( 12756.28 km : 10 px). the sun could be represented with 1090 pixels, and so forth. if the resulting graphic is saved to a smaller scale of 50%, then the resulting scale of proportion would be (12756.28 km : 5 px), and the graphic can now fit on a web page without horizontal scroll bars (if the window is wide enough).
to keep in mind how the scales of both graphics relate to each other, 1 pixel of the average solar distance represents a magnitude that is more than 23 400 times larger than the magnitude of the equatorial diameter. this means that although the features of a chart are proportional for the particular chart, different scales of proportion are needed for each chart.
now let's consider how a scale of proportion can be determined for a graphic of a common paper-size format. as most paper sizes in our everyday world are readily measured in terms of a millimeter, it is convenient to note the dimensions of paper-size in millimeters. for example, dimensions from the ISO A-series of paper sizes (ISO 216) include the following:
- A0—841 ✕ 1189 mm
- A1—594 ✕ 841 mm
- A2—420 ✕ 594 mm
- A3—297 ✕ 420 mm
- A4—210 ✕ 297 mm
- A5—148 ✕ 210 mm
the cover graphic of an A4-sized document is thus sized to the proportion of 210 by 297 (the aspect ratio of the ISO A-series is derived from the 4th root of 2 by the inverse of that number). the notion of a scale of proportion can also be considered as a scale of units applied to a proportion. the choice of the scale of units is often in the same terms as the unit of measure. the choice of how many scale units to be applied to the scale of proportion can be considered with reference to the design space.
for a thumbnail-sized image, a scale of proportion of 1 pixel for 1 millimeter (1 mm : 1 px) can accommodate the presentation of a thumbnail of an A4 document on a web page. for a larger proportional image, however, a source graphic can be created for a proportionately larger number of pixels. some graphic-editing applications provide options to save an image proportionally in terms of a given dimension.
in cases where one might create graphics for documents of different sizes, and one wishes to present proportional thumbnail graphics for each item, then it is quite practicable to choose a scale proportion of (1 mm : 1 px).
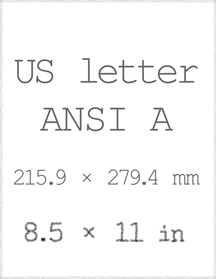
the ANSI A (US Letter) paper size can also be proportionally represented (215.9 by 279.4 mm) as 216 by 279 pixels. here the graphic for the ANSI A paper size is depicted with a convention for a customary style. the 'typewriter' typeface Courier New is applied to the customary letter format. this graphic is presented as a customary paper size because the aspect ratio does not follow for any other paper size format (and thus enlargements or reductions will result in unused paper space).
of course the scale of proportion can be adjusted to fit a particular design scenario. whenever suitable, a pixel can be scaled to represent a larger or a smaller measure.
and if your computer is still configured to default customary scale units, then consider configuring your computer operating system and software applications to show scales in metric units. best wishes for a productive metrication month, week, and day.


|
❄ content management and development services ❄ e books ❄ sci net ❄ puzzle ❄ privacy ❄ contact |
Ronald L Stone
web
|
 Twitter @photonron
| enhanceability.com web page updated: |
| d3Z35 ✦ t115 |
| UCN 12013 Z35 yearend ✦ IDC UT t115 tt324 |
| 2013 day of year 365 |
| AD 2013 December 31 Tuesday ✦ SMH UT 02:46:04 |